The 2010 Haitian outbreak was the largest cholera epidemic to strike a single country in recent history.

Flowminder team members Linus Bengtsson, Xin Lu and colleagues provided estimates of population movements from the cholera outbreak area to relief agencies responding to the outbreak.

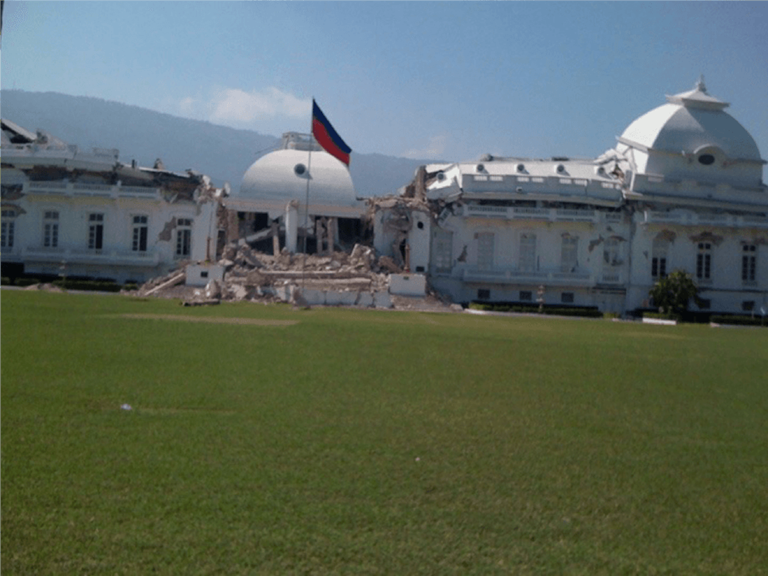
The Presidential Palace After The Earthquake

The presidential palace following the earthquake. Photo credit: Linus Bengtsson

Using Mobile Phone Data to Predict the Spatial Spread of Cholera

The October 2010 Haitian outbreak was the largest cholera epidemic to strike a single country in recent history. As of November 13, 2013, the Haitian cholera epidemic had caused 8,448 deaths, and 689,448 cases had been registered.

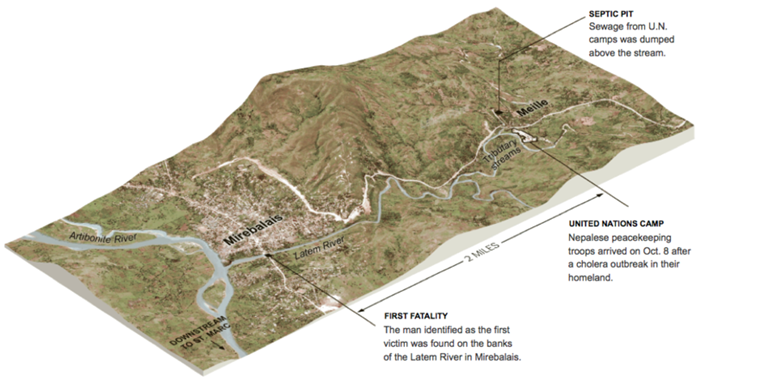
Haiti had just endured the tragic earthquake ten months previously, leaving hundreds of thousands of people homeless, forced to live in temporary camps or with crowded host families. The government was severely crippled after years of weak governance and large-scale damage to infrastructure. Haiti had not endured a cholera outbreak for at least a hundred years. The population had no immunity and the health system had no previous experience of any similar large-scale epidemic. The outbreak commenced with the contamination of the Artibonite River by a Vibrio cholera O1 strain near Mirebalais, 60 km north of the capital Port-au-Prince. The first confirmed cholera case resided in Meille, a hamlet two miles south of Mirebalais, and developed symptoms on October 14, 2010. 

3D Map Haiti Cholera Outbreak 2010 (1)

Image credit: New York Times

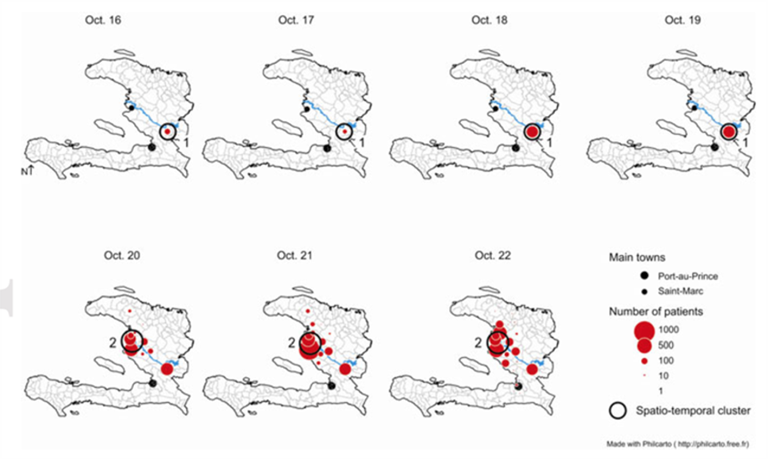
By October 19th, cases with severe diarrhoea were reported upstream in Mirebalais. October 20th marked an explosion of cases throughout the communes of the lower Artibonite River valley, where bacterial transmission afterwards was confirmed to have taken place via the Artibonite River. Cholera was not present in Haiti before the time of the outbreak and the initial suspicion that the sudden spike in severe diarrheal disease actually was cholera came on October 21st. This was followed by rumours among relief agencies that large numbers of people were leaving the cholera outbreak area, moving North and North-West.

Evolution Of Cholera Cases

Evolution of cholera cases during the first week of the Haitian cholera epidemic.

At this time Drs. Linus Bengtsson, Xin Lu and colleagues already had an established collaboration with Digicel Haiti, providing analyses to relief agencies on the distribution and movements of displaced people after the earthquake.

Digicel Haiti HQ

Digicel Haiti HQ the day after the earthquake. The building stood up well after the earthquake. CEO Maarten Boute and Head of Products and Pricing David Sharpe oversaw and led the work on the Digicel side, the first time ever a mobile operator provided access to mobile operator data in a severe outbreak situation. Photo credit: David Sharpe, Digicel

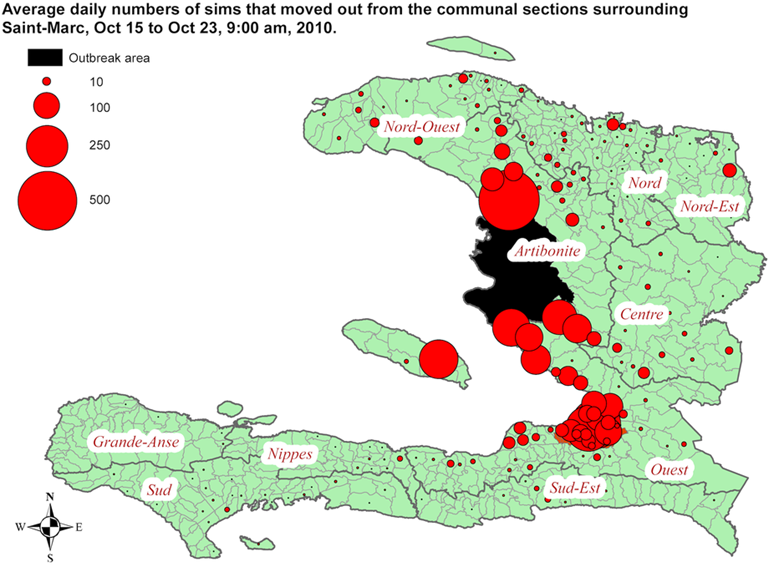
Within 12 hours of accessing new data from Digicel Haiti, the team provided analyses on the movements of anonymised mobile phones to all relief agencies mobilizing to the outbreak. The analyses showed that large numbers of people were moving towards the capital Port-au-Prince and to the city of Gonaives in the outskirts of the outbreak area. Contrary to the ongoing rumors, the North-West received very few people.

Movements Of Mobile Phones

Movements of mobile phones out of the early outbreak area.

There was little preparation for a severe cholera outbreak in Haiti. The epidemic gradually spread across Haiti during the course of two months, infecting hundreds of thousands of people.

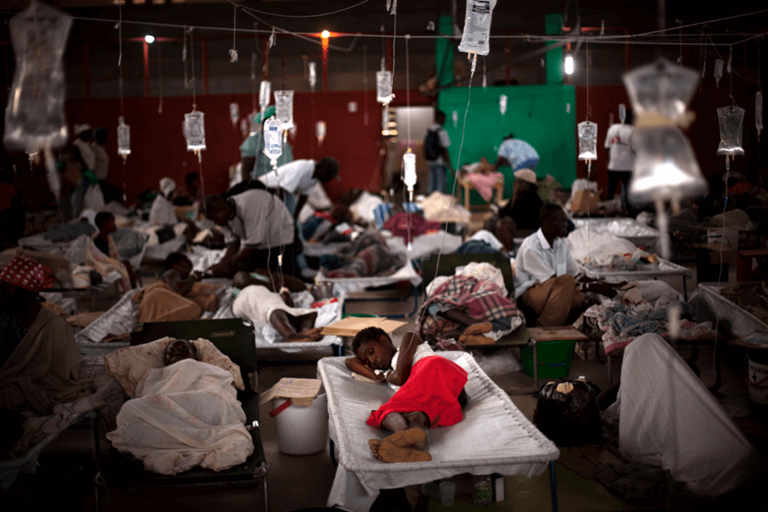
Cholera Hospitalisation

To date, among a population of 9,996,731 people, 421,410 people have been hospitalized due to cholera and 8,927 people have died. Photo credit: New York Post

Cholera spreads primarily through two ways, either through infected water or by the movements of infectious people.

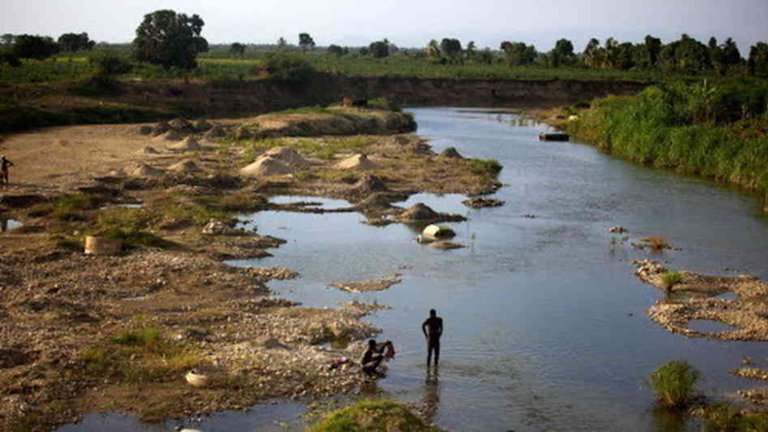
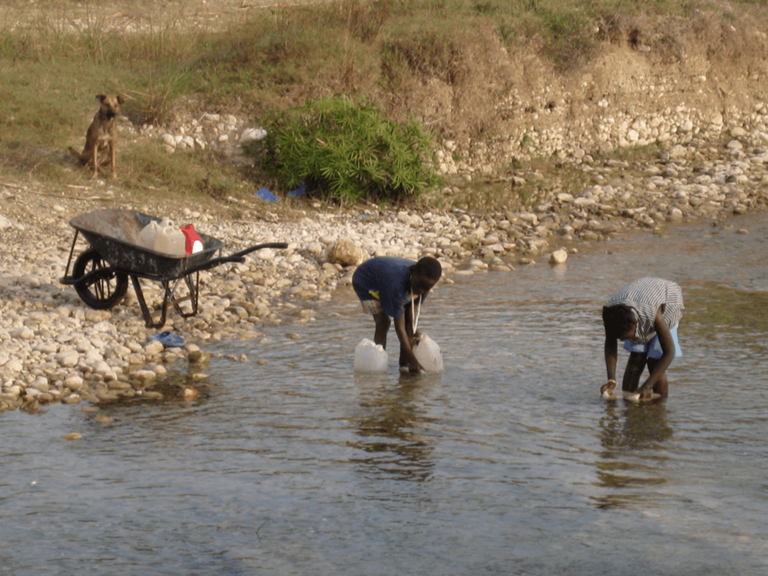
It is now well established that the early spread of the epidemic took place through the Artibonite River. The river is the source of drinking water and also where many people defecate. This provides ideal conditions for the spread of the bacteria.

Artibonite River Daily Life
Daily Life Artibonite River

Everyday life at the Artibonite river. People bathe and collect drinking water from the river. Photo credit: NPR, Fox News

While we saw the movements of mobile phones from the outbreak area as an important predictor of where the epidemic would spread, we cautioned relief coordinators that this had not yet been proved, as a similar methodology had never been undertaken in an outbreak situation.

Several years later we were able to create a collaboration with Prof. Renaud Piaroux at Marseille University, an infectious disease epidemiologist with long experience of cholera epidemics from diverse settings, who together with colleagues and in collaboration with the ministry of health in Haiti had painstakingly collected data on a district level, maintaining a database of daily case numbers per district in Haiti. Together we could then evaluate the extent to which the mobile data predicted the spread of cholera across the country.

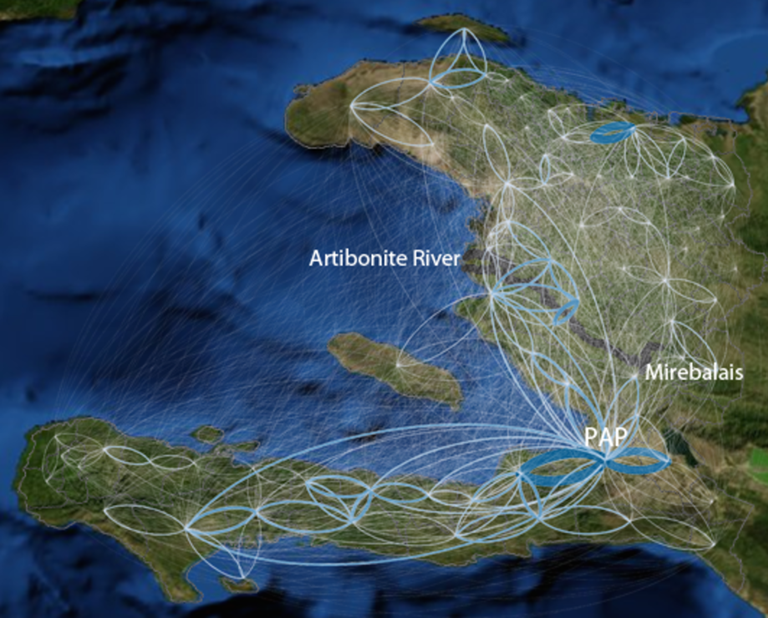
Mobile Phone Mobility Network

Figure 1 | Mobile phone mobility network. The average absolute number of mobile phones moving between the study areas (October 15 to December 19, 2010). Thicker, bluer lines indicate larger number of travelers. The original outbreak location (Mirebelais), the Artibonite River (dark blue) and Port-au-Prince (PAP) are depicted. Credit: Using Mobile Phone Data to Predict the Spatial Spread of Cholera by Linus Bengtsson et al.

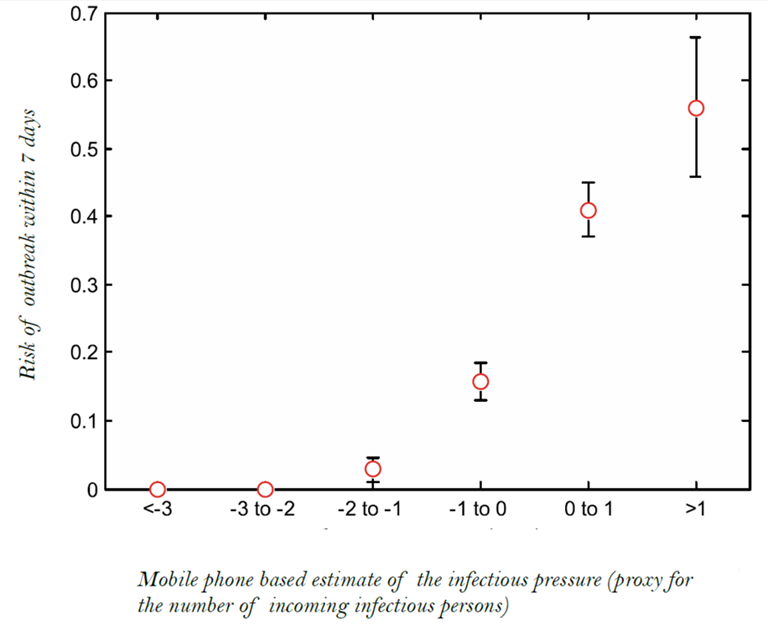
The results showed that mobile phone mobility patterns enabled prediction of the epidemic spread, which was better than standard models on how populations tend to move and which modelers are forced to use if real-life data on movements are lacking. In addition to predicting the risk of a new outbreak appearing in an area we were also able to show that the mobile data was correlated to the size of an ensuing outbreak. The latter is crucial to be able to steer health care resources.

Estimate Of Infectious Pressure

Relationship between infectious pressures, calculated from the mobile phone data and the risk of areas experiencing a new outbreak within seven days. Ninety-five per cent confidence intervals based on a binomial distribution are included. Credit: Using Mobile Phone Data to Predict the Spatial Spread of Cholera by Bengtsson et al.

These findings are of crucial importance when it comes to stopping the spread of new pandemic strains of influenza or other emerging pathogens. Preparing mobile phone data and combining this data according to similar methodology used here may be crucial in stopping new strains during the first critical phase of an epidemic, when the outbreak still is confined to a small area.

Flowminder is currently scaling this methodology across its operations.

Additional Resources

Using Mobile Phone Data to Predict the Spatial Spread of Cholera

Scientific Reports, Mar 2015